HEX DEREF PRO
HEX DEREF is a professional reverse engineering software written in C
#/C/C
++ and it is designed for generic reverse engineering, memory scanning,
dynamic kernel and malware analysis. The software represents something like:
(A SIMPLIFIED DYNAMIC VERSION OF IDA PRO | AVX2 OPTIMIZED MEMORY SCANNER) WITH AN ADVANCED MEMORY VIEWER
For whom the program is intended?
- A malware analyst who need to analyze obfuscated kernel level anti-cheats and AV's
- If you're into learning windows internals, malware or rootkit analysis. Memory forensics is one part of the task and the software offers advanced memory scans for windows kernel and user mode processes
- Cheat or an anti-cheat developer
- You teach information security (IT) researchers in trainings, universities or colleges
- If you wanted to see how the structure looks like and changes in kernel memory in real time
If you're reversing a malware, or just researching windows kernel internals for whatever reasons.
You get the most out of the tool when you use the software in conjunction with WinDbg Preview and the kernel debugger (KD).
 *
* A DKOM functionality is provided in the tool like a solution for reverse engineering and researching tasks.
For example an advanced malware or an anti-cheat may not like the presence of monitoring tools and closes itself when it detects one. Having the ability to disable kernel patch protection on the fly allows you to hide the non-allowed processes.
* * *DO YOU NEED A CUSTOM VERSION OF THE KERNEL DRIVER FOR YOUR NEEDS OR OTHER SOFTWARE WORK?
- The prices start between $499 - $4,999 USD depending on your needs
- Please read this POST to learn more about payment methods and project delivery terms
- Leave a message with your contact details on the official support thread if you want to use PayPal or cryptocurrenty as your payment method
* The kernel page table walk feature allows you to dump pretty much every user and kernel memory page. This functionality enables an unattainable level of analysis and disclosure of information from the kernel memory
and makes many things possible such as offline memory forensics analysis for cases you suspect that your computer is infected with a malware or rootkit.
Despite all the efforts (as of 06/2022, 5+ years of development), the tool is a work in progress (WIP).
KEY FEATURES
- In active development. Simpler to use, more sophisticated and user-friendly than most of the competition
- An advanced memory viewer with memory editor, capable of drawing real-time any user's process and arbitrary kernel memory
- Multi-threaded 64-bit disassembler that is designed for analysing large binaries
- AVX2 optimized memory scanner for user mode processes
- Interoperability between tools
- Kernel physical memory scanner
- Kernel memory viewer (R)
- Kernel memory editor (W)
- Memory pointer scanner
The software includes both a signature scanner and a generator for user mode processes and the kernel. The generated signature is unique for the process.


KERNEL DRIVER FEATURES
If you need a custom version of the driver. Your driver will be coded with C/C++ and according to the contract/agreement you may also get the source code of the driver.
The base driver is coded in "C" and features as follows:
- Test and "bypass" any user or kernel mode anti-cheat
- Direct kernel object manipulation (DKOM) functionality enables you write arbitrary windows kernel memory
- Kernel physical memory scanner
- Disassemble any kernel module including the kernel itself with IDA PRO like 64-bit multi-threaded disassembler
- Dump any user mode process (including protected ones) or any kernel module
- Able to obtain the following information: User mode process base address and size, the PEB with loaded modules, memory protection information for any user mode address
- Able to read and write the registry via the driver
- Find a sequence of bytes (page table walk covering the entire kernel physical memory)
- Able to create an unique assembly signature pattern off the whole process. If you for example dump the kernel and generate a signature in IDA. The generated signature is not necessarily unique
- Find an array of bytes in physical memory
- Kernel page table walk which allows you either to scan or dump the entire kernel physical memory
- Arbitrarily modify kernel memory
- Enumerate PoolBigPageTable memory ranges
- Stackwalk for system threads
- System thread APC injection
MEMORY VIEWER KERNEL MODE

The kernel mode (KM) in the software is an advanced memory viewer mode that also enables windows direct kernel object manipulation (DKOM).
In this mode the memory viewer can read and write arbitrary kernel memory through the driver (without the need to enable kernel debugging) making the tool a sophisticated alternative to WinDbg.
As in user mode, you can see the kernel memory in real time as it changes.
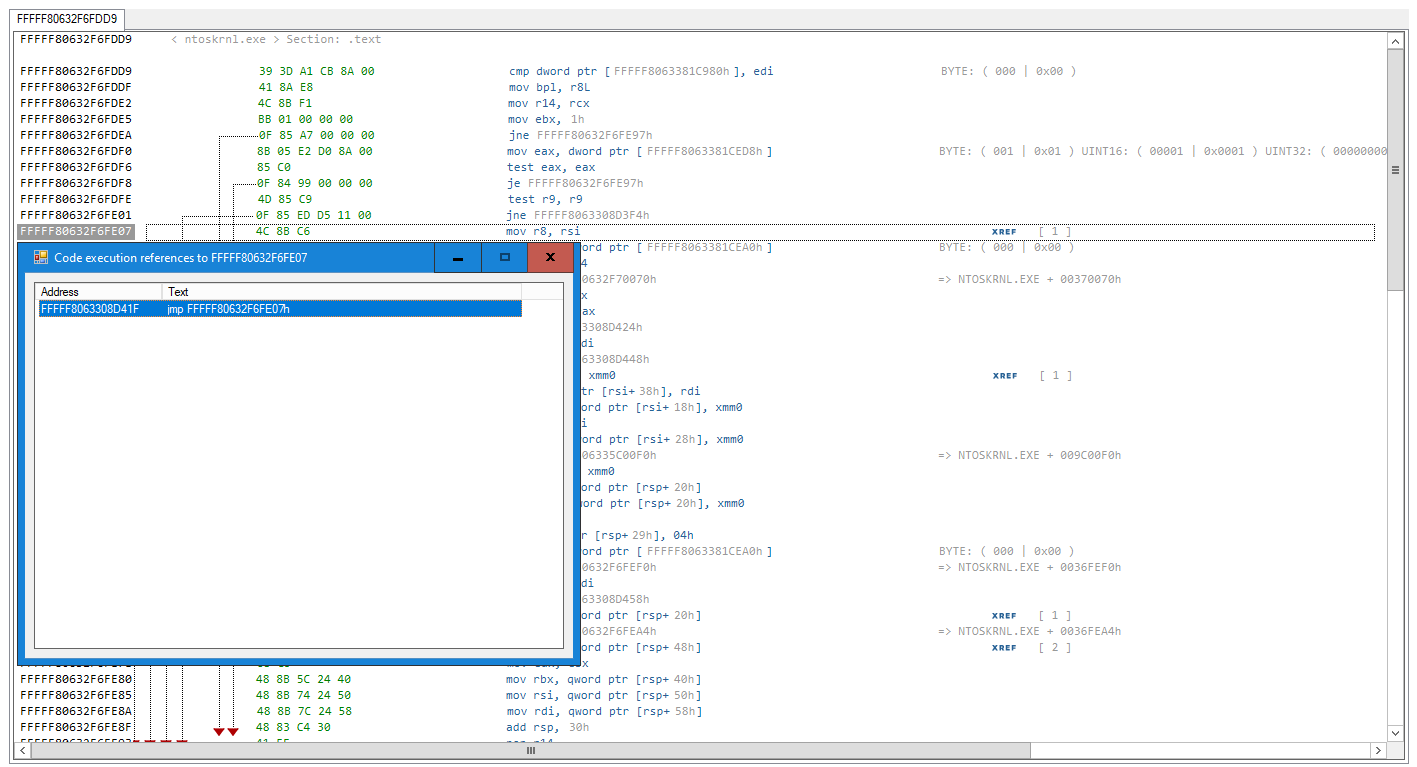
Once the code has been analyzed. The tool also displays code execution references (X) in "DATA/STRUCTURES" mode as shown in above screenshot.
MEMORY VIEWER DATA/STRUCTURES MODE

Helps you to understand memory alignment better, what a memory pointer is and how it looks like in process or kernel memory, how structures and primitive data types looks like in computer memory which is crucial in terms of learning a programming language such C#, C, C++.
The debug viewer tool extends fore mentioned functionality to the next level as it can grab the data behind the pointers and you will see the values that changes in the process memory.
- The memory viewer includes both "DATA/STRUCTURES" and DISASSEMBLY mode. Change the mode on the fly between the two in the same instance
- Change the alignment on the fly (8 Bytes, 4 Bytes, 2 Bytes and 1 Byte)
- Tab support
- Fully dynamic (e.g static pointer references are shown in "DATA/STRUCTURES" mode on the fly while the code analysis is running)
WHAT IS THE MEMORY VIEWER'S DATA/STRUCTURES MODE?
It is a memory structure analysis mode that attempts to find out the structure of classes in memory without source code, the offsets are automatically applied to a given address. This functionality allows you to restructure undocumented windows kernel structures.
DISASSEMBLER FUNCTIONALITY
- Shows all intermodular function calls to the external API functions
- Code execution cross-references (XREF's)
- Static pointer references like in IDA PRO
- String references
- Fully dynamic multi-threaded 64-bit disassembler
- The import address table (IAT) auto-detect feature that attempts to detect also redirected IAT's without the need to use WINAPI functions.
- The disassembler includes a built-in assembly signature maker plugin that attempts to generate unique signatures off the whole process

DEBUGGER FUNCTIONALITY
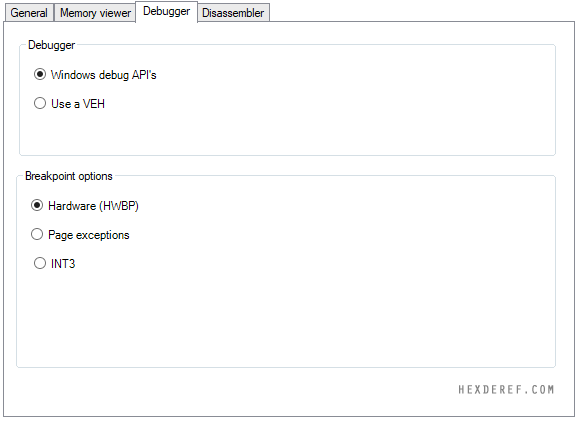
- Windows debugger that uses windows debug API's to debug: DebugActiveProcess, DebugActiveProcessStop, WaitForDebugEvent and ContinueDebugEvent.
- A 64-bit VEH debugger written in C++ (x86_64)
- All major breakpoint methods are supported (Hardware (HWBP), INT3 and page faults) in both debugger modes.

MEMORY POINTER SCANNER
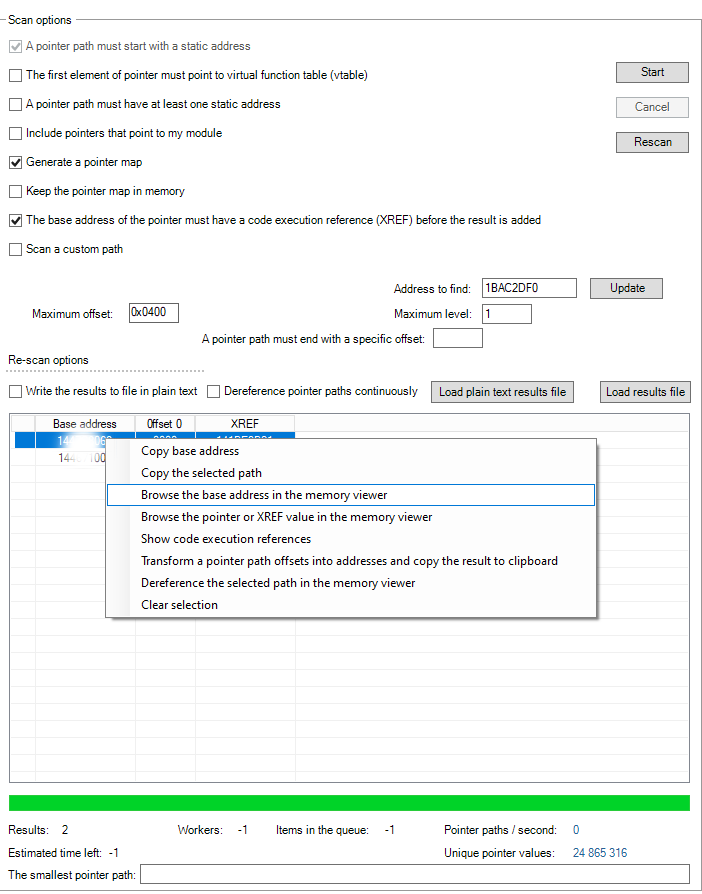
The memory pointer scanner tries to resume from where it left off in other similar softwares. Note the interoperability with the code dissection feature of the memory viewer as you can see the pointers with the code XREF.
Custom path scanning enables for a previously an unattainable level of analysis without the need to generate a pointer map.

HEX DEREF INJECTOR
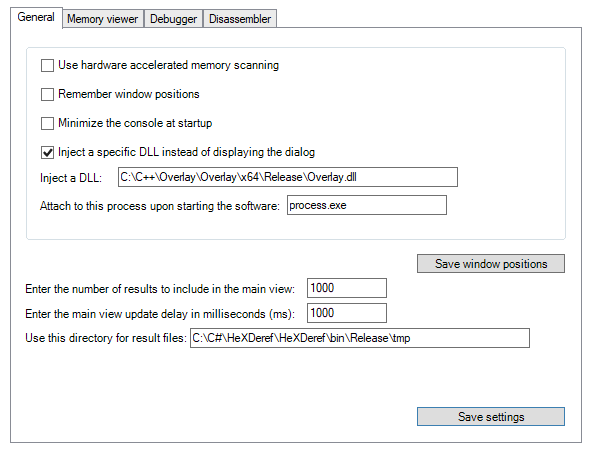
The software includes also a basic DLL injector. The injection is done by using native injection. The native injection means that no attempt is made to hide the injection in the process.

SOURCE CODE
The source code of the software has not been released anywhere (exception to the codes I posted on my
GitHub).
The software is not a port of any existing tool. It has been pretty much written from scratch.
ABOUT AUTHOR
I am self taught coder currently without a daily job. My motto is. If I need to get something done. I will just do it and I am usually very good at what I do. How long you been coding? As of 10/2021:
- PHP/MySql 10+ years: One of the many examples what I've coded in PHP (I can for example, port Ipv4DB PHP to C#): IPv4DB
- C# 7+ years
- C++ 1.5+ years
- C
What you've been doing the past 12 months as of 12/2022?
- Windows internal kernel researching/reverse engineering. I am currently testing DKOM functionality in my driver as well (hide a process, elevate a handle and so forth). This information is available for sale if the price is reasonable enough. I am emulating (reproducing) pretty much what kernel level anti-cheats does in my "C" kernel driver to understand how they work and how to bypass anti-cheats. While I did aforementioned things. I also learned network based windows kernel debugging with WinDbg Preview. I also have a better understanding of kernel crash dumps.
How long you been hacking and reverse engineering?
- For years. It's not up to time because one learns things faster than the other. However though, I do know reverse engineering (RE) basics.
PARTNERS ARE NEEDED
I've spent a considerable amount of time researching windows internals and coding the software, and the project literally takes all of my free time.
Therefore I must ask for a little contribution towards the project. If you host a quality reverse engineering or cyber security related blog or forum. You can earn real money with advertising the software with your referral code on your site.
Check out
Referral system (registration is required)
The kernel driver and functionality is not included in the free version of software. If you host a quality security research related forum or blog, and write related articles.
A partner or sponsor can have their company logo on this site with a backlink. Leave a message with your contact details in the
support thread or PM me (White Byte) in the tool Live Support.
- Comodo standard OV code signing certificate (85.00 USD/year)
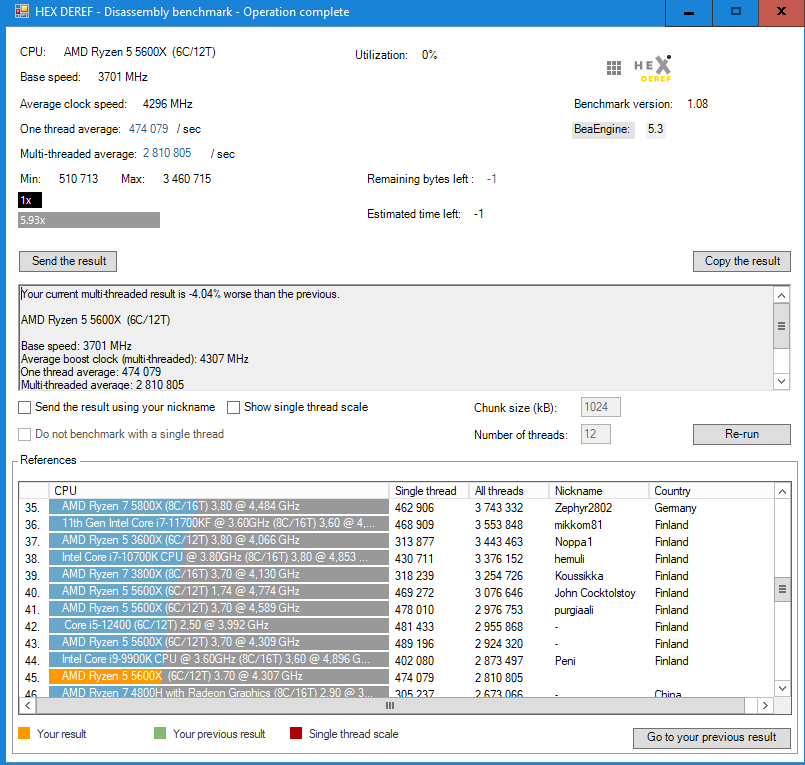
DISASSEMBLY BENCHMARK
The larger the process is, the more you will benefit off a multi-threaded disassembler ("Analyze the code" feature in a memory viewer).
The benchmark is included in the main software which translates machine instructions into human-readable more convenient assembly language statements using the
BeaEngine.

LIVE SUPPORT
Sometimes simple is better. Therefore I've implemented probably the most simplest chat in the tool.
NOTE: Use the live support in the tool for bug reports and questions. If none is online. Ask a question and check back later.
EULA
HEX DEREF software later referred to as "the software", is provided "AS IS", without warranty of any kind, for educational and informational purposes ONLY.
In no event will the author be held liable for any damages arising from the use of this software. By using the software the user accepts all responsibility for any and all actions performed.
IF YOU DO NOT AGREE TO THE TERMS OF THIS LICENCE AGREEMENT, DO NOT INSTALL, COPY OR USE THIS SOFTWARE. BY INSTALLING, COPYING OR USING THE SOFTWARE YOU AGREE TO ALL THE TERMS AND CONDITIONS
OF THIS AGREEMENT.
CHANGELOG
CURRENT DEVELOPMENT VERSION: v1.11 (TO BE RELEASED)
Main view
- Added Settings−>Disassembler−>Generate a byte pattern only for the active module
Memory viewer
. . .
- Fixed an issue in kernel mode with active module information when the address of the root node changes
- When drawing a string from behind a pointer, show it's type
- Improved readability
- Fixed an issue with string type auto detection (C-style/UTF-16)
- Fixed an issue with tabs
- Fixed an issue when drawing a unicode string behind a pointer
- If the base address is a kernel address, draw the pointer only if it points to a kernel address
- Fixed an issue with displaying section name in disassembly mode
- Disassemble a module−> use the entry point address instead of the text section
"C" kernel driver
- PatchGuard bypass at runtime
- Stackwalk for system threads
- Enumerate kernel timer tables (_KTIMER_TABLE)
Dec 19th, 2022 v1.10
Main view
- Added support for kernel physical memory scans as follows: Physical memory scan options
- Fixed an issue with the process name when dumping a process
- Fixed an issue when dumping the process memory to a file with unknown initial value scan
- Added Tools−>Dump−>Kernel memory
- Added Settings−>Disassembler−>Copy bytes without wildcards when generating a signature
- Fixed an issue in the string tool with the memory viewer
- Added support for string scans in kernel mode (KM)
- Added Settings−>Kernel driver interface (KDI) and an option to define driver device name
- Simplified handle elevation DKOM functionality
- Added in settings an option to define driver name
- Fixed an issue when scanning user mode process memory when kernel mode (KM) is enabled
Memory viewer
Added the following options for Tools−>Search−>Find a sequence of bytes:
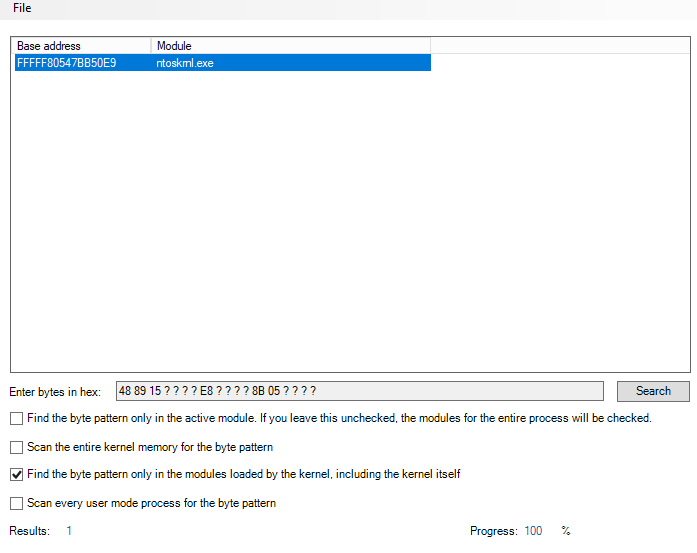
- Find the byte pattern only in the modules loaded by the kernel, including the kernel itself _
- Scan every user mode process for the byte pattern
- Added progress indicator when scanning user mode memory
- Fixed an issue when drawing the primitive value from the address pointed by the instruction in disassembly mode
- Added Tools−>Scan for memory patches in the current view. The results are currently echoed on the console, and the value of each unique base address can change up to (4) times
- Fixed an issue with the section list when analysing the code
- Show the section name for the currently entered address in disassembly mode
- Use the same monospaced font for the tabs and the base address
- Update the tab name to the hexadecimal value of the address you entered
- When analyzing the code, search for code execution references (XREF's) that refer to a specific immediate value
- Generate automatically a C#-style byte array after generating a signature for the instruction
- Show DATA execution references (XREF's) for the address pointed by an instruction in disassembly mode
- Stability fixes
- Added in Tools−>Search−>Find a sequence of bytes an option to convert string to bytes
- When searching for a byte pattern, treat zero as a literal instead of a wildcard byte
- Fixes an issue with a code style signature when scanning for an array of bytes in memory
- Fixed an issue in disassembly mode when drawing a string behind the address pointed to by the instruction
- Once the code has been analysed. If there is no XREF to the instruction address in disassembly mode. Show instead code execution references (if exists) to the address pointed by the instruction (referred to as DATA XREF's in IDA PRO)
- Fixed an issue when browsing user mode process memory when kernel mode (KM)is enabled. This enables you to browse the protected process memory without the need to elevate the handle
"C" kernel driver
- Fixed BSDO in physical memory scanner when scanning kernel and each user space process for byte pattern
- Added an option to enumerate big page pool memory regions (PoolBigPageTable)
- Dump kernel memory with virtual addresses into a file. The UI in "MainForm" is able to dump all strings from the dump
Disassembly benchmark
Has been updated to version 1.08 with the following changes:
- Use bytes from the kernel to make the test less synthetic
- The default chunk size is 1024kB (The amount to be disassembled per thread)
The following condition must be met before you can send the result (the default settings):
- The benchmark must be run on all threads
- You must also include the result of one thread
- The size of the chunk must be 1024kB
May 15th, 2022 v1.09
Main view
- Fixed an issue in kernel mode (KM) when retrieving the base address and size of an image
- Fixed an issue in result files with reading and writing UInt64 values
- Added support for kernel memory scans (Byte, 2 Bytes, 4 Bytes, 8 Bytes and Hex)
- Default memory scans as follows: 2 Bytes (UInt16), 4 Bytes (UInt32), 8 Bytes (Int64), Hex (UInt64)
Memory viewer
- Fixed an issue with pointer validation in a non-kernel mode
- Draw a primitive value from the address pointed by the instruction in disassembly mode. e.g "FFFFF80646DA1783 - 44 84 3D 48 89 88 00 - test byte ptr [FFFFF8064762A0D2h], r15L". Draws a value from a bold address.
- Tools−>Dump or disassemble the module−>Sections−>Added "Use the file on the disk for comparison instead of memory"
- Tools−>Dump or disassemble the module−>Sections−>Added an option to scan selected section for memory patches or the entire image
- Fixed a "flicker" problem when pointer values were changing constantly
- Tools−>Search−>Find a sequence of bytes−>Search the entire kernel memory for the byte pattern
- Fixed a logic issue in the disassembly mode. Draw the data in the following order at the address pointed by the instruction: 1) Draw API information 2) Draw a string reference. A string reference is a string at the address pointed by the instruction. 3) If the first and the latter one does not exists, draw a primitive value such a byte
- Tools−>Views−>Sections−>Added an option to scan the entire image for memory patches
March 31th, 2022 v1.08
Main view
- Fixed logic issue with automatic process attach
- Fixed unhandled exceptions with protected processes where an anti-cheat downgraded handle access
- Added an option in settings to refresh the process list automatically
"C" kernel driver
- Added process handle elevation DKOM feature (elevate a handle to PROCESS_ALL_ACCESS 0x1FFFFF). All possible access rights for a process object
- Added DKOM based process hiding functionality
Memory viewer
- Minor UI optimizations (a slightly less lag when drawing user process memory)
- By default show the values as unsigned
- When you modify a value in memory, the value entered can also be a hexadecimal number
- Fixed various unhandled exceptions with protected processes
January 31th, 2022 v1.07
Main view
- Added an option to sort processes by PID
- Show protected processes in gray in the process list
- Added an option to dump with the right-click the protected user mode process (a stripped handle access) with the driver
- Edit−>Settings−>General−>The size of the buffer when reading memory is customizable
Memory viewer
- Filter non-printable characters also when reading the Unicode UTF-16 string
- Tools−>Process modules−>When listing kernel modules, translate the path of the NT namespace to the actual module path
- Tools−>Views−>Sections−>Map the PE file as SEC_IMAGE so the sections gets correctly aligned and displayed in section view
- Tools−>Views−>Sections−>Added an option to find an array of bytes in the selected section
- Tools−>Views−>Sections−>Added an option to scan the selected section for memory patches
- Fixed an issue in the logic that determines whether or not the section is executable
- Take a peek behind the pointer feature shows the values as unsigned
"C" kernel driver
- Implemented a page table walk which is pretty much effectively able to find every allocated user or kernel memory page in a matter of few seconds
13/01/2022 v1.06
Main view
- Added the following process features with the right-click in both user and kernel mode: Suspend, Resume, Terminate
- Find an array of bytes functionality has been moved in the memory viewer
Memory viewer
- Added support for reading and writing arbitrary kernel memory (including any user mode process) through the driver.
- Dereference memory pointers as a 64-bit unsigned integers. This enables the windows arbitrary kernel memory to be read and written through the "Driver.c"
- Use a mono-spaced font for "equal columns" and pad a primitive data types with leading zeros for a better readability
- Added Tools−>Dump or disassemble the module−>List the modules of an open process
- Added Tools−>Dump or disassemble the module−>List kernel modules
- Added Search−>Find a sequence of bytes
- Added checkbox option Search−>Find a sequence of bytes->Find the byte pattern only in the active module
- Added an option to modify the value of the selected address as Unicode UTF-16 string
- .
Live support
- Fixed an issue where the last message the user posted did not appeared in the chat
White Byte © 2025 HEXDEREF.COM - DO NOT REPRODUCE CONTENT WITHOUT PERMISSION
 * A DKOM functionality is provided in the tool like a solution for reverse engineering and researching tasks.
For example an advanced malware or an anti-cheat may not like the presence of monitoring tools and closes itself when it detects one. Having the ability to disable kernel patch protection on the fly allows you to hide the non-allowed processes.