April 29th, 2022
THE LAB SETUP: Windows 10 Pro 22H2 debugger host (physical machine) with Hyper-V guest (a VM that is being debugged remotely over the internet).The article is useful for those who knows at least the basics of reverse engineering (RE). The following abbreviations are used in later parts of the article:
- Kernel debugger: KD
- Local kernel debugger: LKD
- Hardware breakpoint: HWBP
- Virtual machine: VM
- The VM or physical machine to be debugged: DEBUGGEE
- Install Debugging tools for Windows
- The default folder for kdnet.exe is C:\Program Files (x86)\Windows Kits\10\Debuggers\x64. The PDB files are in C:\ProgramData\dbg\sym folder.
You can use My headers to get your IPv4 address (REMOTE_ADDR == IP). Required steps in Hyper-V VM:
- Run a command prompt with administrator privileges
- Go to the default KDNET folder
- Run as administrator "kdnet.exe IP 50005". Replace "IP" with your debugger host machine IPv4 address
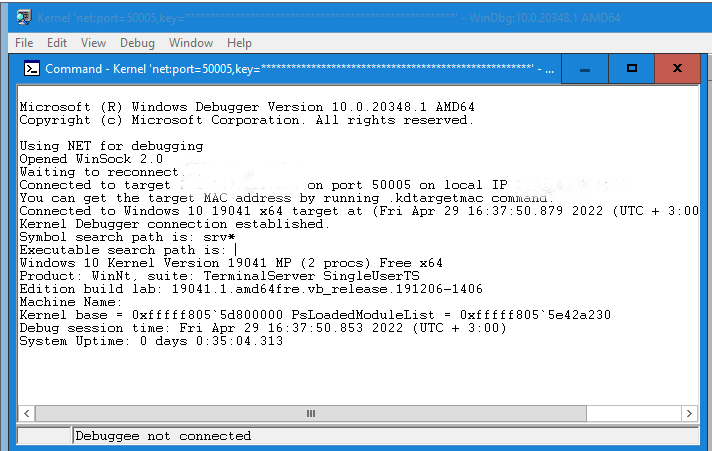
You should get output something like:
windbg -k net:port=50005,key=<string> (copy the line to the debugger VM before you reboot)
- Run "shutdown -r -t 0" to reboot that VM
After you've rebooted your VM to be debugged with above command. The following steps are required on the debugger VM (a physical machine running a VM)
- Command Prompt->Run as administrator
- Go to the default KDNET folder as you did on debuggee VM
- Run the command you copied to clipboard and WinDbg Preview should start waiting for the connection to the debuggee VM
If the kernel debugger is attached on boot, PatchGuard is not initialized by design. You can reproduce this by starting WinDbg Preview on your debugger host as explained above and then rebooting the debuggee VM.
It is worth mentioning that once the kernel debugger is attached, Code Integrity (CI) allows unsigned code to load. The following breakpoint may occur several times when loading an unsigned driver when the KD is attached: CI!CipReportAndReprieveDriverAndProtectedImageFailure
When kernel debugging is enabled, the byte at "nt!KdDebuggerEnabled" is set to "1" and the byte at KUSER_SHARED_DATA 0xFFFFF780000002D4 is set to "1" as well. After the KD is attached to the debuggee, the value of the same byte is set to "3".
lkd> dt _KUSER_SHARED_DATA FFFFF78000000000
User-mode counterpart for _KUSER_SHARED_DATA is at 0x7FFE0000
You should see DbgPrintEx messages on KDNET console in the same way as in the local kernel debugging mode.
If you get "could not resolve symbol" error in local or remote kernel debugging mode, you can fix the issue by typing below commands:
lkd> .reload
WinDbg comes with a built-in up to date symbols for the kernel and system modules loaded by the kernel.
Additionally for your convenience you may want to disable driver signature enforcement (DSE) by enabling test signing mode before enabling KDNET.
You can enable test signing with the following command (reboot after):
- Bcdedit.exe -set TESTSIGNING ON
- Bcdedit.exe -set TESTSIGNING OFF
Hardware breakpoint options:
- Read: ba r 1 <address> /1
- Write: ba w 1 <address> /1
- Execute: ba e 1 <address>
For a software breakpoint (INT3), use the "bp" command (execute only).
Select from the menu Debug->Break, and set a breakpoint. At this point you will lose connectivity to VM. Once you've setup the desired breakpoint and whenever a breakpoint has been hit. To continue, you need to press the 'g' or use the option in the menu (Debug->Go). Use the bl command to view current breakpoints.
If you want to debug kernel routines, use "bp nt!KdTrap". To view global variables values in WinDbg Preview, run "db nt!KdpTrap". This command displays only the first byte to this variable.
Local kernel debugging
Local kernel debugging is disabled by default. To enable or disable local kernel debugging, run either command as an administrator and reboot. After that start Windbg Preview and select "Start debugging->Attach to kernel" and select the local tab.
- bcdedit -debug on
- bcdedit -debug off
If you get "Levels not implemented for this platform" with the !pte command. You may need to restart your machine several times until you get results (an obvious bug in WinDbg).
The default WinDbg Preview symbols folder is C:\ProgramData\Dbg\sym.
You can also use the debugger to modify the kernel memory:
kd> ed 0xFFFFF80082734C18 0 0
The above command sets the first byte to 0 at that address.
Debugging a userspace process
To debug user mode process named "Console.exe". After you've enabled local kernel debugging. Run "!process 0 0 Console.exe" to get it's PEPROCESS address. And then run ".process /p /r PEPROCESS". Now you can debug windows API's by symbols e.g "ba e 1 user32!GetWindowLongA"
Kernel crash dumps
The memory referenced in the minidump in kernel crash dump is the same as kernel physical memory dump (MEMORY.DMP). You can change crash dump options in Startup and Recovery. Run->sysdm.cpl
and select the advanced tab
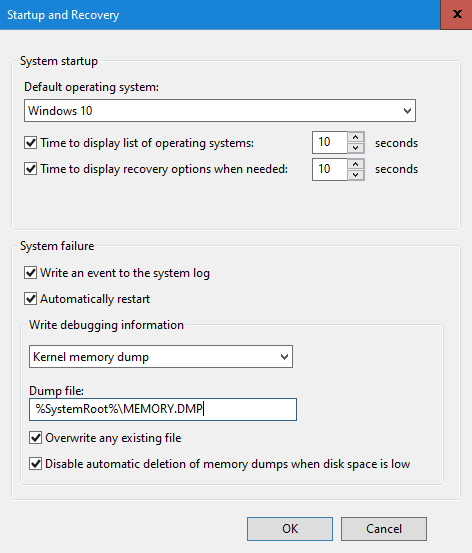
The default folder for kernel crash dumps is C:\Windows\Minidump.
WinDbg Preview commands
kd> uf Driver!MyExceptionHandler
kd> !drvobj MsSecFlt 2
- Show the first 512 bytes of a specific address: db <address> L 0n1512
- Debug driver DRIVER_OBJECT: !drvobj MsSecFlt 2
Kernel routine debugging with symbols
The first four integer arguments of the function (parameter passing on x64) are in the registers: RCX, RDX, R8, R9. Respectively for floating point arguments: XMM0, XMM1, XMM2, XMM3. The rest of the parameters are on the stack (RSP). The RAX register is used for return values. To retrieve function parameters. Steps as follows:
- Set a hardware breakpoint at the beginning of the routine and press the "g" key to go
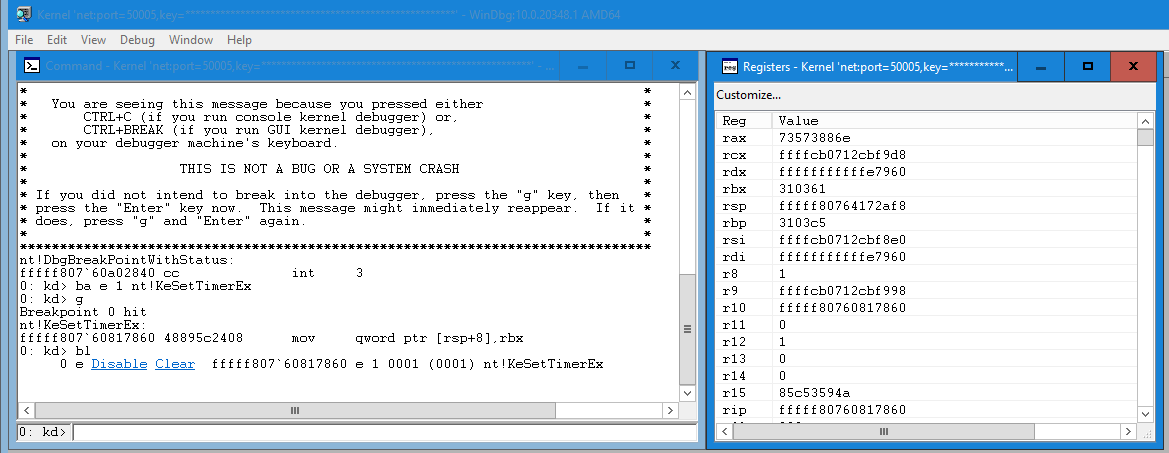
- Once the breakpoint has been hit. You'll temporarily lose connectivity to the VM because the debugger took control
As shown in the image above. Use the "bl" key to disable or clear the breakpoint and then press the "g" key to go. If none of your breakpoints are hit, the connection will restore itself.
On x86 the first stack argument will appear at [ESP+04h]. The example is for x64. Get the function arguments from the stack:
0xFFFFF80764172AF8 FFFFF80763783FBC >> Return address
0xFFFFF80764172B00 0000000000000000
0xFFFFF80764172B08 FFFFCB0712B6D480
0xFFFFF80764172B10 FFFFCB0717365086
0xFFFFF80764172B18 0000000000000000
0xFFFFF80764172B20 000000000000ACC2 >> ARG5 >> [RSP+28h]
0xFFFFF80764172B28 000000000000BB01 >> ARG6 >> [RSP+30h]
0xFFFFF80764172B30 0000000000000018 >> ARG7 >> [RSP+38h]
0xFFFFF80764172B38 FFFFCB07FFFFFFFF . . .
0xFFFFF80764172B40 FFFFCB0716486BF0
0xFFFFF80764172B48 0000000000000000
0xFFFFF80764172B50 FFFFCB0712A387A1
0xFFFFF80764172B58 0000000000000000
0xFFFFF80764172B60 FFFFCB0712B6C7C0
0xFFFFF80764172B68 0000000000000000
0xFFFFF80764172B70 0000000000000000
Dereference the pointer in kernel memory
If you get could not resolve the symbol name. You must perform the symbol fix once.
kd> .reload
Debug driver DRIVER_OBJECT: !drvobj MsSecFlt 2
EFI kernel debugging
It is possible to debug EFI modules with KDNET on early boot. Setup kernel debugging over the internet as instructed below.
The required steps for boot time debugging:
- bcdedit -debug on
- bcdedit /bootdebug {current} on
- bcdedit /set hypervisordebug on
- Run as administrator "kdnet.exe IP 50005" to get the key for the debugger. Replace "IP" with the debugger Ipv4 address
Steps as follows on debugger host:
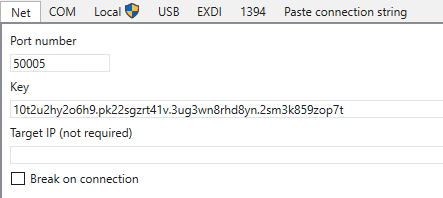
- Paste the key in the "Net" tab you received from the VM and press the OK button to connect
- Run "shutdown -r -t 0" to reboot debuggee. Once connected, break. Optionally you can check "Break on connection"
It is worth noting that once you've set the initial breakpoint ("sxe ibp"). You'll need to reset the breakpoint with the sxr command when you want to stop debugging.
Without a reset, you'll end up in an endless debugger loop even when you stop debugging in WinDbg or WinDbg Preview. In the worst case, if the connection is lost during the session. You'll lose permanently access to the VM or physical machine you was debugging because of the automatic breakpoint on boot. Therefore it's recommended to take a backup.
Optionally you can use USB cable or a named pipe over a virtual COM port. This is not fully covered in the article.
- sxe ld:winload (winload.efi)
- sxe ld:nt (Kernel)
- sxe ibp (Sets the initial breakpoint so the debuggee will automatically break on boot)
- .reboot
Now you can set a HWBP for a specific routine. The breakpoint should appear in the list on the right
Press the "Go" button or "g" to continue